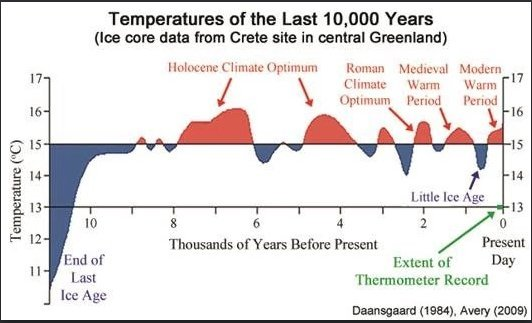
Graphs show for each region, the proportion of total number of sequences (not cases), over time, that fall into defined variant groups. Regions are displayed if they have at least 20 sequences in any variant being tracked. They are ordered by total number of sequences in tracked variants.
Head in the sand argument. The variants monitored across the globe in the most decentralized sequence surveillance ever performed show no sign of your swarm.
A few variants dominate the sequence for a few months and are replaced. What is shocking the actual lack of a swarm. pic.twitter.com/GS1w6Etb1C
This Twitter thread will not unroll. It can be found here. It is a strong refutation of the idea (first proposed by JJ Couey, I believe) that covid has been a psyop ornamented with swarms of ‘infectious clones’ deliberately released to provide newsworthy symptoms and positive PCR tests in enough parts of the world to make the pandemic look real. McKernan believes the pandemic is based largely on fraudulent PCR tests. The open debate and evidence based ideas presented are healthy and I am glad to see this happening. ABN
In this issue of the Army-Navy Screen Magazine series (No. 85), viewers are treated to a short documentary on the U.S. Navy’s Antarctic expedition, Operation Highjump, a 1946-1947 mission to Antarctica to establish the Antarctic research base Little America IV, to assess the feasibility of maintaining a permanent base, and further American understanding of the continent that led to global peace treaty that restricts research and travel to Antarctica.
The Antarctic Treaty was signed in Washington on 1 December 1959 by the twelve countries whose scientists had been active in and around Antarctica during the International Geophysical Year (IGY) of 1957-58. It entered into force in 1961 and has since been acceded to by many other nations. The total number of Parties to the Treaty is now 56.
Public health agencies should be held to a high standard, yet they are getting away with spreading false information and accusing others who have posted factual information, of doing the same.
“It’s like a horror movie I’m being forced to watch and I can’t close my eyes,” one senior FDA official said. “People are getting bad advice and we can’t say anything.”
It’s a shame that the agencies tasked with protecting us may be doing the exact opposite. It’s nearly impossible to rely on them for accurate information, guidance and data when it comes to all things health.
If physicians and public health officials in the US remain silent and fail to admit past mistakes, harmful policies will persist or resurface in the next pandemic. Why wouldn’t they? Without us defining what went wrong or creating an ethical framework to prevent the same mistakes, why would they stop?
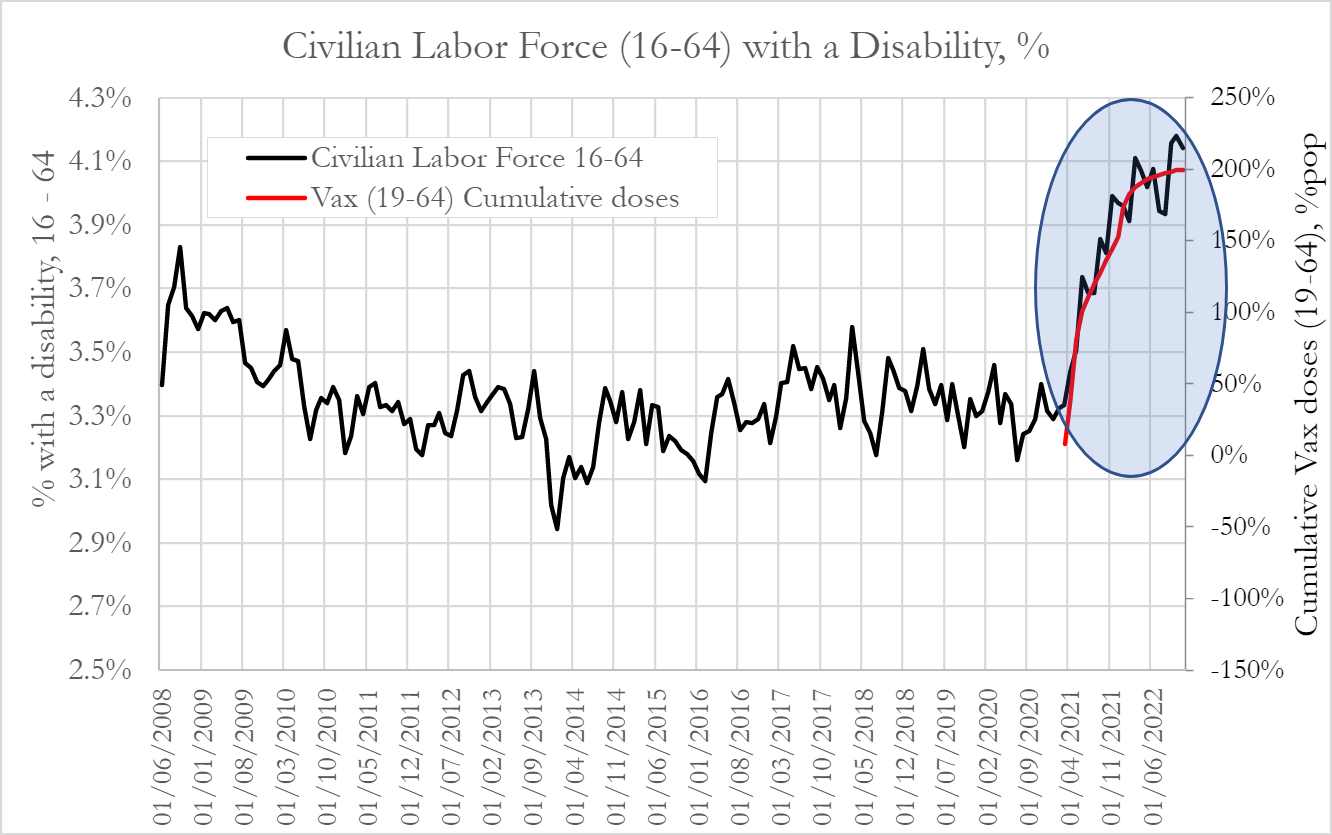
A new report estimates that 26.6 million people were injured, 1.36 million disabled, and 300,000 excess deaths can be attributed to COVID-19 vaccine damages in 2022 alone, which cost the economy nearly $150 billion.
Research firm Phinance Technologies, founded and operated by former Blackrock portfolio manager Ed Dowd, Yuri Nunes (PhD Physics, MSc Mathematics) and Carlos Alegria (PhD Physics, Finance), split the impact of the vaccines into four broad categories to estimate the human costs associated with the Covid-19 vaccine; no effect or asymptomatic, those who sustained injuries (mild-to-moderate outcome), those who became disabled (severe outcome), and death (extreme outcome). Data on vaccine disabilities and injuries comes directly from the Bureau of Labor Statistics (BLS), while the excess death figures are derived from official figures on deaths in the US via two different methods (methodology here).
It’s important to note that people in one category (injured, for example) can move into latter categories of severity – which this analysis does not take into consideration.
“We need to remember that not only are these groupings an attempt to characterize different levels of damage from the inoculations, they are not static and could interact with each other,” reads the report. “For instance, there might be individuals who had no visible effects after vaccination but nonetheless could still be impacted.”
“Individuals with mild injuries from the inoculations could, over time, develop severe injuries to the extent of being disabled, or an extreme outcome such as death.”
The analysis of disabilities is split into 5 parts that can be read independently but are related and complement each other. Each section is written in a different web page within which at the top the user can find the links to navigate to the other sections. The 5 parts are:
Part 1 – Overview of the Data. Go to Part 1 This part provides the overall description of the data and shows the historical time series of disability rates for different population cohorts and age groups. It allows us to put in perspective the changes in disability rates, that started in 2021.
Part 2 – Rise in disabilities from 2021. Go to Part 2 This part provides a detailed examination of the changes in disabilities that ocurred from early 2021, which coincided with the vaccine rollouts.
Part 3 – Relationship with Vaccine uptake. Go to Part 3 This part analyses the relationship between the rise in disabilities with the Covid-19 vaccine rollout.
Part 4 – Relationship with Excess Deaths. Go to Part 4 This part investigates the relationship between excess mortality and the rise in disabilities that ocurred since early 2021. It also provides us with an estimate of how many disabilities occurred for each excess death, during the period.
Part 5 – Relationship with SAEs in mRNA clinical trials Go to Part 5 This part investigates the relationship between Serious Adverse Events (SAEs) from the mRNA clinical trials with the rise in disabilities that ocurred since early 2021.
Part 6 – Relationship with Severe AEs in Pfizer vaccine clinical trial Go to Part 6 This part investigates the relationship between Adverse Events (AEs) and Severe Adverse Events (Sev AEs) from the Pfizer clinical trial with the rise in disabilities that ocurred since early 2021.
There is a huge global effort to engineer a computer capable of harnessing the power of quantum physics to carry out computations of unprecedented complexity. While formidable technological obstacles still stand in the way of creating such a quantum computer, today’s early prototypes are still capable of remarkable feats.
For example, the creation of a new phase of matter called a “time crystal.” Just as a crystal’s structure repeats in space, a time crystal repeats in time and, importantly, does so infinitely and without any further input of energy – like a clock that runs forever without any batteries. The quest to realize this phase of matter has been a longstanding challenge in theory and experiment – one that has now finally come to fruition.
“The big picture is that we are taking the devices that are meant to be the quantum computers of the future and thinking of them as complex quantum systems in their own right,” said Matteo Ippoliti, a postdoctoral scholar at Stanford and co-lead author of the work. “Instead of computation, we’re putting the computer to work as a new experimental platform to realize and detect new phases of matter.”
“Time-crystals are a striking example of a new type of non-equilibrium quantum phase of matter,” said Vedika Khemani, assistant professor of physics at Stanford and a senior author of the paper. “While much of our understanding of condensed matter physics is based on equilibrium systems, these new quantum devices are providing us a fascinating window into new non-equilibrium regimes in many-body physics.”
Hawking’s final theory of the Big Bang provides a bold and surprising answer. It envisages the Universe as a holographic projection.
Stephen liked to visualise this idea in a disk-like image of the kind shown above. The outer circle depicts a timeless hologram consisting of countless entangled qubits.
The disk shows the evolution of an expanding Universe that projects down from this. The origin of the Universe lies at the centre of the disk and it expands outward in the radial direction.
It is as if there is a code operating on the entangled qubits that brings about the Universe and this is what we perceive as the flow of time.
Crucially, by taking a fuzzier view of the hologram, one ventures farther back in time, toward the interior of the disk. It is like zooming out. Eventually, however, one runs out of bits. This is the origin of time, according to our theory.
There can be nothing before the Big Bang, because the past that holographically emerges doesn’t extend further back.
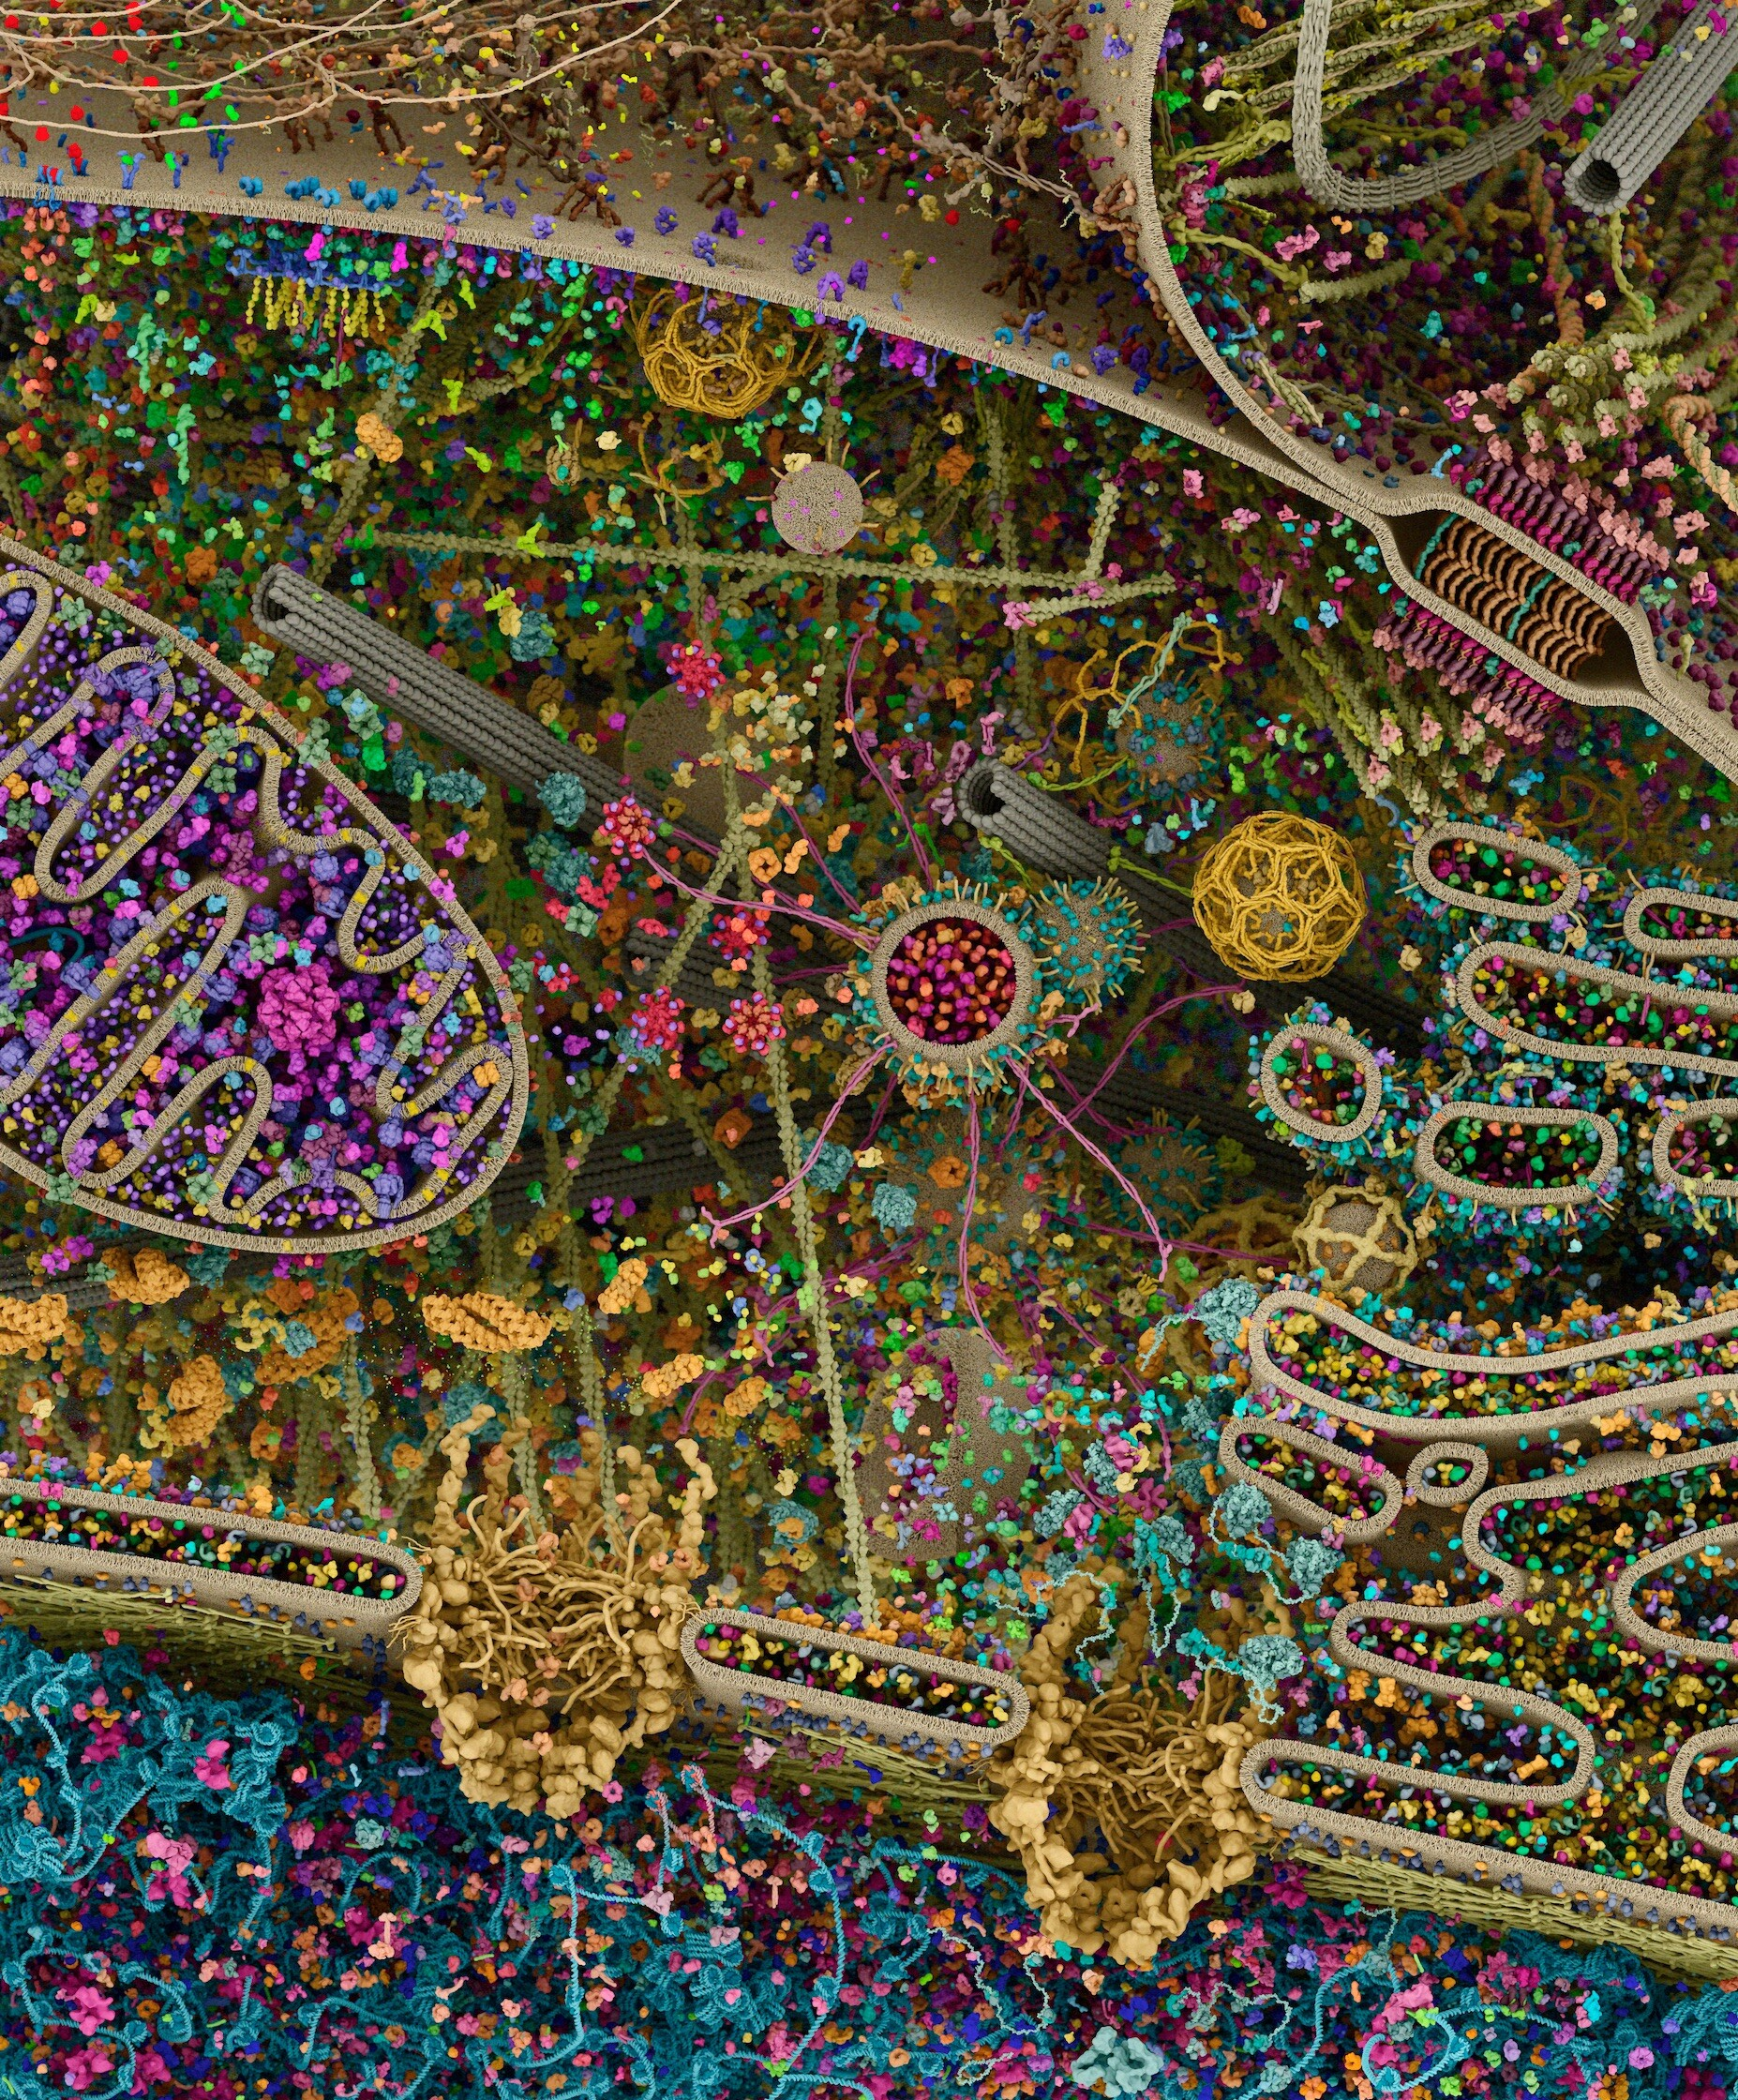
Created for Cell Signaling Technology, Inc., and inspired by the stunning art of David Goodsell, this 3D rendering of a eukaryotic cell is modeled using X-ray, nuclear magnetic resonance (NMR), and cryo-electron microscopy datasets for all of its molecular actors. It is an attempt to recapitulate the myriad pathways involved in signal transduction, protein synthesis, endocytosis, vesicular transport, cell-cell adhesion, apoptosis, and other processes. Although dilute in its concentration relative to a real cell, this rendering is also an attempt to visualize the great complexity and beauty of the cell’s molecular choreography. Interactive versions of parts of this landscape can be explored at http://www.digizyme.com/cst_landscapes.html.
If it’s not due to the vaxxes, what is it due to? And why is this not national news with everyone looking for the answer? Why? Because it is due to the vaxxes and it’s obvious. The government should be presenting these data to the public but instead they are trying to hide it. The linked source materials are excellent and very clearly presented. ABN


